Philadelphia Property Tax Reform - A Progressive Alternative
Note: this is a work in progress. I'm adding data as I find it.
Philadelphia has not revised its property valuations for a very long time. As a result, on average the properties are valued at a third or fourth of their market price. Some properties are valued and taxed at a tenth of the market price.
Recently Philadelphia revalued its properties and is planning to impose this tax reform in 2014.
Mayor Michael Nutter is proposing a 1.32% tax rate with a $15,000 homeowner exemption. The exemption would exclude the first $15,000 of property value from taxation.
The PA state constitution has a Uniformity Clause which makes progressive taxation difficult. For instance, you cannot charge a different rate of taxes for low income people versus high income people. The property tax rate has to be the same for houses of different value and the same rate has to be applied for commercial property that is applied to residential.
So the City has to identify workarounds that promote a more progressive system of taxation. For instance, you can exempt the first $15,000 of a property from taxation.
The two problems with the home owner exemption are:
1) It does not help renters who make up 45% of Philadelphia households.
2) You have to apply for it. The current rate of application varies from 20% (low value homes) to 55% (high value homes).
Renters are more likely to be low-income and people of color.
My proposal is a Property Exemption of $30,000. This would benefit both home owners and renters. The renters would benefit due to the fact that landlords pass on their costs (including taxes) to the renters - so while the landlords would have lower taxes, the people who benefit are their renters.
A Property Exemption of $30,000 combined with a property tax rate of 1.45% would raise enough money to fund the city and school budgets.
The Property Exemption is the ONLY progressive tax alternative that has been proposed. Nutter's proposal would increase tax on 100% of renters, and only provide small decreases ($50) to the bottom 50% of homeowners. By contrast the Property Exemption (30k) would provide a $150 decrease to both renters and home owners in the bottom 50%.
Unfortunately a property exemption would need approval by the state assembly (as do many other changes to Philadelphia taxes). The home exemption has already been approved.

Property Tax Change by House Value

Note: negative values mean a decrease in taxes.
Homestead Exemption Application Rate

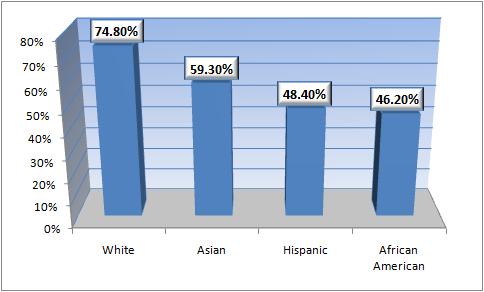
Home Ownership by Race (United States) - 2009
Home Ownership by Income - United States - 2010
Income Percentile and Home Ownership
0-20 : 37.2%
20-39.9 : 55.9%
40-59.9 : 71.1%
60-79.9 : 80.7%
80-89.9 : 90.6%
90-100 : 92.4%
Source: Changes in US Family Finances from 2007 to 2010. Federal Reserve. Table 9. Page 47.
Another home ownership by income data set for 2011 (using the March Current Population Survey)
Income Percentile : Home Ownership percent
0-20: 44.1%
20-40: 57.1%
40-60: 68.3%
60-80: 78.4%
80-100: 87.8%
Source: Home Ownership's Wild Ride, 2001-2011.
Philadelphia Home Ownership

I used the Census Bureau's American Community Survey data for a five year period to reduce the margin of error. The margin of error ranges from 3% to 9%. While this allows for a significant difference between these results and the actual home ownership rates - there is clearly a strong income trend and one that correlates with the national trend.
The American Community Survey (2006-2010) data used in the graph above gives a homeownership rate of 55.3% with an error margin of plus or minus 0.3%. The ACS (2007-2011) data shows a slight drop with a homeownership rate of 54.9%. The one-year ACS estimate (2011) has the homeownership rate down to 54.0% (311,303 / 576,429) with an error margin of 1.3%.
Correlation of House Values with Household Income
The American Community Survey data for Philadelphia shows a modest correlation between the two.
Using the American Community Survey data and a Public Use Microdata Sample for Philadelphia, I found a strong 0.52 correlation between House Value and Household Income (NOTE: I originally had a 0.74 correlation here due to an ERROR). That means that about one quarter of the house price can be explained (or predicted) by only using one variable - your household income. This reflects the fact that house prices in a neighborhood vary by less than incomes.
Methodology
I'm using the 2013 and 2014 assessment data from the Office of Property Assessment
I imported the data into a MySQL database. I excluded properties if in either the 2013 or 2014 data set they had a missing market value or a zero value.
I wrote a PHP script to do analysis. I imported the data into Open Office Calc to make charts.
Do Landlords Pass on Taxes to Renters?
There are different theories as to whether landlords pass on the cost of property tax to renters. In general, landlords set their price based on the cost of providing housing and the demand for it. If their cost goes up, then they will ask for higher rents or try to lower their costs by providing less maintenance. If anyone has a link to a study on this issue, I would like to hear about it.
ITEP says that landlords pass on "some" of the increase to renters.
Resources
-Map of property tax changes
-AxisPhilly Tax Analysis
AxisPhilly analysis of AVI vs Sales Prices
-Philadelphia Controller's Report - main Controller Office website
-Institute for Taxation and Economic Policy's report on Homestead Exemptions (doesn't mention renters in detail)
-Who Pays? A Distributional Analysis of the Tax Systems in All 50 States - PA is one of the ten most regressive.
-report by Kevin Gillen (note: the numbers for commercial properties are different if you exclude abated properties, and I get very different results that he has for residential impacts)
Philadelphia campaign finance reports database
Tax Flight is a Myth: Higher Taxes bring Higher Revenue, Not More Migration
Crosstown Coalition of Taxpayers - Philadelphia coalition of neighborhood groups supporting fair taxes.
Media
-News Works and their Tax Blog
-Philly Inquirer
- Login to post comments
Correction
I originally found a 0.74 correlation between income and housing prices in Philadelphia. However I did a mistake in my calculations and the actual correlation is 0.52 (or more precisely 0.518). This means the relationship between the two is much weaker than I previously thought.
On the one hand this means that taxing properties with greater value is not as progressive as I thought it was. But on the other hand it is also a major indictment of just how regressive property taxes are as the property valuations and taxes are only weakly correlated with income. We should shift away from using residential property taxes.
Exemptions
This data excluded anything that had an exemption. This might be altering the result significantly for the top 10% of properties. I'm currently getting very different results with the latest extended OPA data set. It shows the top 10% of residential properties facing a tax decrease with AVI, whether they rent or own.
Renters
45-46% of Philadelphia households rent. However some philadelphia renting households who live in 2-5 unit buildings may benefit from the homestead exemption IF the building owner lives in the building AND they choose to share their savings with the rest of the building.
I think this is most likely to happen in buildings with a small number of units.